For most people, who do not necessarily have a deep understanding of either physics or the CEZ’s characteristics, this seems to be an intuitive explanation that it is easy to assimilate. The problem is that this theory contradicts not only every scientific paper published about the CEZ, but also the most basic concepts of dosimetry. Let’s see why.
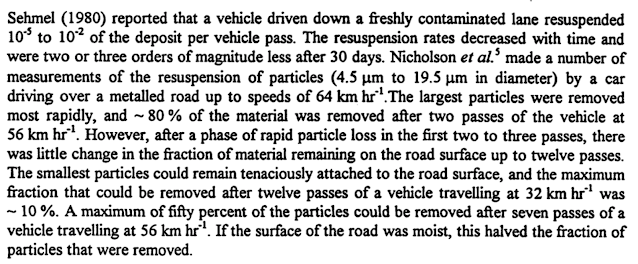
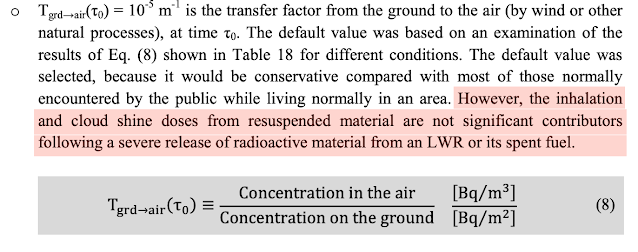
If we obviate those cases where the resuspension occurs right after a significant deposition due to a massive radiological accident, the scientific consensus is that resuspension only accounts as a contributing factor in calculating the inhalation dose, being almost negligible from an external exposure perspective, and therefore also negligible to calculate the H*(10).
This is relevant, as some of the recorded spikes were in the range of OIL2γ levels (25 µSv/h - 100µSv/h), allegedly as a result of a resuspension event, which directly contradicts the methodology and equations published by the IAEA.
Unphysical timings
Even if we consider the traffic-induced resuspension of soil as a plausible explanation of the radiation spikes, we will find that the timing between intense traffic activity and radiation spikes does not match either.
I created the following diagram, based on the timeline of events previously elaborated. It helps us see that the spikes were not detected during the period of intense vehicular activity but, coincidentally, ten minutes after the SNRIU lost control of the radiation and nuclear facilities in the CEZ.
Figure 61 Visual timeline
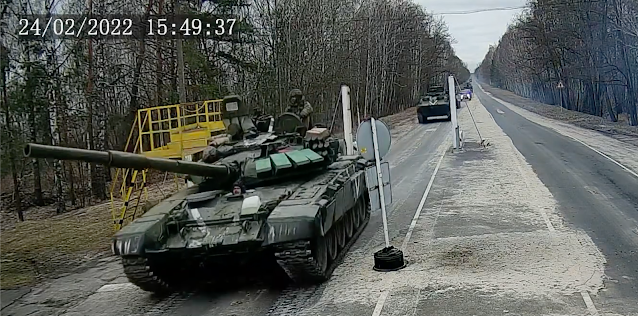
This unphysical behavior is clearly observed when analyzing the spikes recorded by the Kopachi station, which were only detected approximately 18 hours after a convoy passed nearby (at 9:20 AM, the morning of the 25th) as I depict in the following image.
Figure 62 Kopachi - video
According to the ‘resuspension of soil’ theory, GammaTRACER probes should have detected increased radiation levels at the time of this intense traffic activity, during which even the climatological conditions were slightly more favorable, and not many hours afterwards.
For instance, from a physical perspective, it is also difficult to explain why dose rate spikes at the Vilcha Radiation Monitoring station, one of the main entry points for Russian troops during the early morning of the 24th, were not recorded until more than 12 hours later, at 12:10 AM, during the night of the 25th of February.
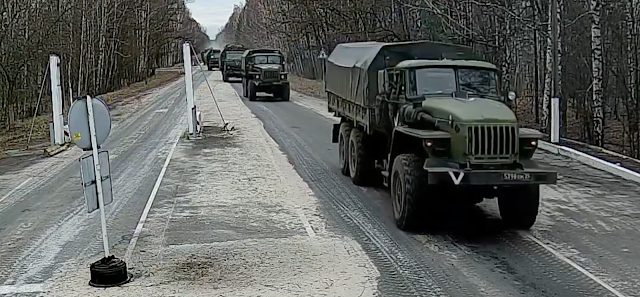
The same video also provides us with an interesting piece of information.
Figure 63 Radiation Portal Monitors - Video
The cameras that recorded the video are part of another
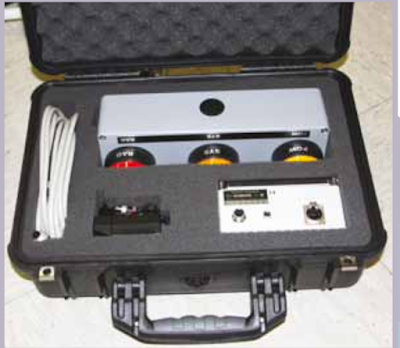
radiation monitoring system, different from the ASKRS, installed at the CEZ checkpoints for the purpose of non-proliferation control. The two white pillars located on the left lane are part of a VM250 Radiation Portal Monitor.
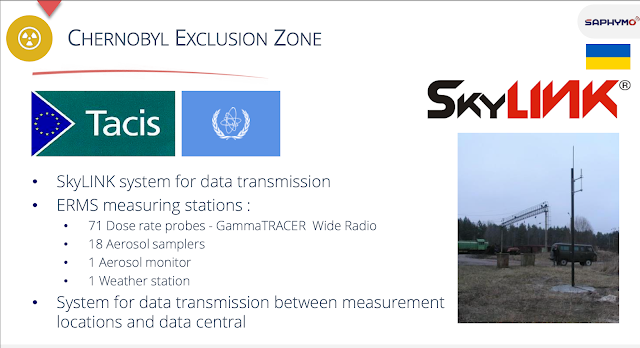
Figure 64 Ecocentre presentation
As can be verified in the
various manuals that can be found online for the
VM250, this system continuously monitors the background Gamma radiation, triggering visual and acoustic alarms if abnormally high (or low) values are detected. This is a common functionality of Radiation Portal Monitors (in 2017 I also reported vulnerabilities in some of them).
It is worth mentioning that in the video it is apparent that there is no light indication that shows either high background levels or high Gamma radiation, even when vehicles are passing through the VM250.
Besides this, there are a couple of facts that should also be noted:
1. The VM250 can switch over to battery power when AC is lost.
2. Recorded values were sent to a central processing station. There is no information about whether the server containing these records was recovered or examined.
Did a significant resuspension event ever happen in the CEZ? The following section analyzes this scenario.
The perfect storm of 2020
The scientific literature agrees on the fact that, among the anthropogenic and natural activities that may lead to resuspension of radioactive materials, forest fires have the biggest impact. The extent of this influence covers both transport (and redistribution due to a subsequent deposition) and contribution to the increment of the activity of radionuclides in air.
In April 2020, the Chernobyl Exclusion Zone suffered a ‘perfect storm’ of forest fires, the largest ever recorded in the zone. One-third of the land area of the Ukrainian CEZ was burnt, but to make matters worse, a
dust storm occurred during the 16th and 17th, a combination that
resulted in a significant amount of resuspended
137Cs. The resulting plumes reached Kiev and, marginally, other territories in Europe.
The magnitude of the wildfires was great enough to be tracked by
ESA and
NASA satellites.
Figure 65 Satellite image of wildfires
Despite this appalling scenario, the GammaTRACER devices did not report abnormal levels of radiation. Let’s not forget that these are the same devices that, in 2022, allegedly reported radiation peaks tens of times higher than the configured control levels, not just the baseline levels, due to traffic-induced resuspension.
The IRSN published several reports analyzing these wildfires. In
one of them I found something interesting, let’s have a look at it in order to introduce the next part of the analysis.
Figure 66 IRSN statement on CEZ wildfires
1.- To begin with, they reference the same Ecocentre website used by the official sources during the Chernobyl incident in 2022. Then they provide a key observation, ‘it should be remembered that these measurement devices are only capable of detecting major radiological accidents’. This is in concordance with what has been laid out previously, as the resuspension only matters for external exposure right after a major accident.
Finally, they acknowledged the same probes are used, at a nationwide level, in France.
2.- The ‘radioactivity released’ basically means the resuspended 137Cs (in addition to other radionuclides such as 90Sr).
3.- This is particularly important in our scenario, as 14 of the 39 regulatory radiation monitoring stations were equipped with the АУРА-02 aerosol monitor units. During the Russian invasion of the CEZ, 8 of them reported radiation spikes: Chistogalivka, Kopachi, Pripyat, Buryakovka, Mashevo, Zimovyshe, PZRO Buryakovka and Benevka.
However, the airborne
137Cs activities have not been published as part of the official information. Obviously, as the CEZ was occupied, the АУРА-02’s aerosol filters that are manually analyzed could not be recovered at that time (before the occupation these filters were collected every 5 days). As I will be elaborating later on, this kind of data would be key to validate the ‘resuspension of soil’ explanation. The image below demonstrates that
137Cs volumetric activities have been
published in the past, for cases where resuspension was involved, like in these forest fires.
Figure 67 137Cs Airborne concentration
For reference purposes: 1 Bq/m3 is the maximum airborne activity of
137Cs detected in Sweden right after the Chernobyl accident of 1986. The Radiation Safety Standards of Ukraine (NRBU)
establishes 0,8 Bq/m3 as the maximum admissible level.
To sum up this profound contradiction:
- The biggest forest fires ever recorded in the CEZ did not resuspend enough 137Cs to provoke an increase of the H*(10) calculated by the GammaTRACER probes.
- Heavy military vehicles driving over decontaminated roads in the CEZ, resuspended enough 137Cs to increase the H*(10) to levels that even exceeded those detected right after the accident at the Fukushima Daiichi NPP.
In the next part of the analysis, I will try to explain why this scenario is not physically viable by using a simple mathematical approach.
A simple mathematical model to understand the unphysical radiation spikes
We have been talking about the H*(10) from a high-level perspective, but now I need to explain a little bit more about its characteristics.
The ICRP defines it as:
"The dose equivalent at a point in a radiation field that would be produced by the corresponding expanded and aligned field in the ICRU sphere at a depth of 10 mm on the radius vector opposing the direction of the aligned field. (ICRP)"
The ICRU sphere is a phantom, intended to approximate the human body, made of tissue-equivalent material.
Figure 68 IAEA presentation
Within this expanded and aligned field all its contributions add up, as we can see in the
ICRP Publication 144.
Figure 69 ICRP - H*(10) components
Figure 70 Expanded and aligned field
As a result, the ambient dose equivalent can be expressed as the sum of the contributions from its n components.
In general terms, there are three main components that will contribute to the H*(10): ground, air and secondary cosmic radiation. However, we can obviate the latter.
Thus, for an arbitrary radiation monitoring station at time t0, we will have a decomposed ambient dose equivalent as follows:
For the same radiation monitoring station detecting a spike at time t1 we would have,
where,
The question is, which component would be enabling this significant increment?
As the official explanation states that these radiation spikes are linked to resuspended radioactive materials, it must be ‘air’.
This also means that our H*(10) ‘ground’ component is representing the baseline level, which allows us to easily perform the calculations when historic datasets are available.
Please note that we are not trying to either harmonize or estimate the H*(10) between different radiation monitoring devices. This approach is possible because we have a dataset that contains years of measurements collected from the same monitoring devices. Thus, despite the different periodicities, after so many years the baseline level for each of these stations is stable enough to be used as a reference.
Figure 71 Radiation spike - component decomposition
It was reported that the additional airborne 137Cs activity due to resuspension of radioactive materials during the 2020 forest fires did not result in an increase of the total ambient dose equivalent in any of the radiation monitoring stations, so we will also have that,
where A2020 would be the set of the ambient equivalent dose rate values for the ‘air’ component, recorded during the 2020 forest fires for an arbitrary station.
However, as this specific dataset is not available, we can rewrite the previous expression based on a response function (fr) representing the GammaTRACER response for the recorded airborne 137Cs activities (Bq/m3). This dataset (α) is available in 14 of the 39 regulatory stations, those that were equipped with the aerosol analysis units as it has been previously mentioned.
This operation is possible because, by convention, if we increase the
137Cs activity in air, the H*(10)air will be incremented as well, ideally, following a linear progression as shown in the
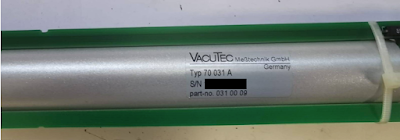
datasets for VacuTec Geiger-Müeller tubes used by the GammaTRACER probes.
Figure 72 Pulse rate vs Dose rate
As a result, we end up with the following expression that we should be able to validate:
Now let’s use Buryakovka, a regulatory radiation monitoring station also equipped with the aerosols monitoring unit, as an example calculation for this model.
Please note that these calculations are not intended to be exact. However, as the allegedly detected radiation spikes levels are so brutal, compared to previous recorded values, the reader will notice the figures still do not match by several orders of magnitude which neglects potential deviations.
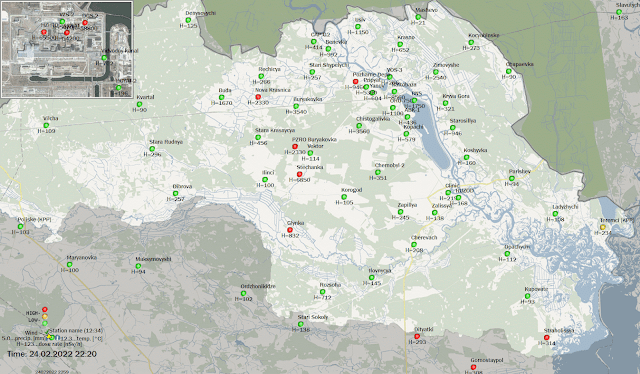
The radiation spike at Buryakovka reached 52700 nSv/h on the 25th of February.
Figure 73 Ecocentre map - Feb 25, 15:00
The historic data collected from different documents shows an average value of around 2700 nSv/h. Then, for this radiation spike the required increment in the ‘air’ component can be easily calculated as follows:
According to this, the resuspension process itself should generate enough airborne 137Cs activity to allow the GammaTRACER to detect 50 μSv/h.
For reference purposes, in 1986, just few weeks after the accident, an estimated dose rate of 50 μSv/h in air was the level used by the authorities to determine the evacuation zones in the 60km area around Chernobyl NPP.
Although, even at this point, 50 μSv/h is an unrealistic increment for a traffic-induced resuspension activity, let’s continue to illustrate the idea behind the model.
In 2020 the airborne 137Cs activity for the Buryakovka monitoring station increased by an order of magnitude compared to previous years. This pattern was also observed in other radiation monitoring stations, due to the resuspension caused by the forest fires.
Figure 74 Volumetric activity
We are trying to validate the expression below, so we still need to come up with a method to realistically approximate the airborne
137Cs
activity (at1) in 2022, as this data has not been made available, publicly, by any of the involved authorities.
The IAEA, responding to the claims that Russian troops dug
trenches in the vicinity of the Red Forest, calculated the estimated effective dose potentially received by those soldiers.
Therefore, to approximate at1 I used the values resulting from the measurements the IAEA performed on-site, which are publicly
available.
Figure 75 IAEA measurements
We are even using a conservative approach, as the assumption is that the concentration of dust in air while digging a trench is equal to the concentration generated by a vehicle passing over a decontaminated road, or even an unpaved surface. We just need to multiply the values highlighted in the previous image (Specific Activity * Concentration of dust in air during digging).
According to the previous ‘Volumetric activity of
137Cs in 2020’ table, we have,
By substituting the values in the expression, we have that at1 is just an order of magnitude higher than the maximum airborne
137Cs activity detected in Buryakovka in 2020.
Assuming the radiation spikes were physically sound, we would have that an airborne 137Cs activity of 2,95x10⁻² Bq/m3 led to the expected increase of the H*(10) until reaching 50 μSvh-1 over its baseline level (‘ground’ component).
Obviously, that is not the case. This activity does not even reach the reference airborne 137Cs activity of 1 Bq/m3 by two orders of magnitude. Also, if it were true, we should be observing 50 μSv/h increases (on top of their baseline levels) in all those stations that recorded similar increments in their airborne 137Cs activities.
As the reader can see in the following example, that never happened.
Let’s take the highest airborne 137Cs activity detected (1,0E-02) during the forest fires of 2020, which corresponds to the VRP-750 radiation monitoring station. This value is in the same order of magnitude as that our previously calculated at1,
Figure 76 Volumetric activity 2020
However, its maximum H*(10) value recorded in 2020 was 1,5 μSvh-1, far from the expected 50 μSvh-1.
Figure 77 H*(10) values 2020
Let’s look at these two images to provide a visual summary of the issue. The indicated H*(10) levels (1, 5 and 45 and 50 μSv/h) do not correspond to any specific station, they are just sample values to illustrate the reasoning, although similar to those officially reported. Please also note that the distances between the elements depicted in the following diagrams are not to scale.
Figure 78 Baseline
1.
The H*(10) level measured in the decontaminated road is 5 times lower than in the nearby contaminated soil. Although this is a sample value, it matches real
ratios mentioned by the IAEA for the CEZ.
2. In our example the GammaTRACER is located really close to the road.
3. The H*(10) recorded by the GammaTRACER is mainly calculated from the 137Cs found in the contaminated soil.
4. The contaminated soil reports a baseline of 5 μSv/h
5. The 137Cs located in the upper layer is the main contributor to the baseline level.
Figure 79 Radiation Spike
1. When the heavy military vehicles pass over the decontaminated road, they will resuspend potentially contaminated dust.
2. The number of resuspended materials is determined by the resuspension factor, which for an intense activity (such as digging) may reach 10-8. Regular activities will have a resuspension factor an order of magnitude lower.
3. The radionuclides stuck to the dust particles will emit gamma radiation whose intensity decreases according to the inverse square law.
4. The resuspended dust particles will be deposited according to their aerodynamics and climatological conditions.
5. The GammaTRACER reaches a level of 50 μSv/h. This means that the resuspended 137Cs is contributing to the total H*(10) with an additional 45 μSv/h. Obviously, this is not possible, coming from a decontaminated road whose baseline is just 1 μSv/h.
The ‘return to baseline levels’ mystery.
The last, but not least, question the previous model raises is the following: Why did the stations return to their baseline levels just few days after the spikes?
According to the ‘resuspension of soil’ theory we have that, either the resuspended materials that caused brutal increments of the H*(10) while airborne, stopped being gamma emitters after the regular deposition phase, or there was no deposition phase at all. Both cases would be equally unphysical. This scenario, in turn, leads to the following never-ending circular problem: How is it possible to achieve higher levels of H*(10) just by resuspending the same materials that were already present in the top layer of the soil?
There are two options:
1. An external release from a radioactive source.
2. A resuspension activity with a massive transport involved.
It is the consensus that the first option never happened. So, we are left with the second one. However, if there was a significant transport (relocation) of radioactive materials, large enough to achieve the reported H*(10) levels: Why did the stations return to their baseline levels just few days after the spikes? And so on.
Figure 80 Resuspension/deposition balance
Basically, what has been reported in the Chernobyl Exclusion Zone is an unprecedented case
in nuclear physics: an unbalanced resuspension scenario without a deposition phase.
This scenario helps us to demonstrate, from an analytical point of view, that the radiation spikes were necessarily fabricated as they do not even comply with the most fundamental physical forces such as Gravity (Stokes’ law). Let’s illustrate this issue with the last 8 radiation levels detected at the Pozharne Depo station (radiation spikes are red-highlighted). This station was one of the six whose radiation spikes were officially reported to the IAEA by the SNRIU.
Table 3 Spikes in Pozharne Depo
Let’s assume these are legitimate readings, so according to the timestamps I am analyzing the spikes from two different perspectives:
a. Intraday
In a period of 20 minutes, between ‘20:40:00’ and ‘21:00:00’, the GammaTRACER allegedly detected a radiation spike 8 times (8790) the regular baseline level, and then returned to the exact baseline level previously recorded (1760).
Figure 81 Timestamps
As the above diagram shows, we can break it down in three steps with their corresponding timestamps,
t0 = Timestamp before the radiation peak, baseline level (< 20:40:00)
tp = Timestamp for the radiation peak (20:40:00)
t1 = Timestamp for the baseline level (21:00:00)
1. At t0 < tp
The plume comprised of the resuspended materials has not yet reached the area of detection for the GammaTRACER.
2. At tp
Resuspended radioactive materials have reached the GammaTRACER, thus provoking a peak. V↓ indicates the deposition velocity (in this case, the lack of).
3. At t1
The plume has left the area of influence for the GammaTRACER, which has then returned to its previous baseline level.
b. Long-term
There are two additional radiation spikes detected, at 21:50:00 (Feb 24) and 10:50:00 (Feb 25), without any other reading in between.
Then, after several days of radio silence, the GammaTRACER transmitted two measurements on March 1, back to its regular baseline levels.
Now let’s demonstrate why this sequence of events is a physical aberration.
Within a small window of time (20 minutes), the GammaTRACER detected a radiation peak and the returned to its baseline level. Please note that this kind of pattern is common during metrological verification procedures, as a certified approved gamma source is brought towards the probe device at controlled steps.
However, we are assessing a traffic-induced resuspension event so in addition to the timespan, there is another major anomaly: lack of deposition phase.
In a traffic-induced resuspension we should not see an ‘encapsulated’ plume like the one shown in the diagram above, instead the resuspended materials will be in touch with the surface via eddy diffusion, as the picture Figure 14 Dust Cloud’ shows. We should also note that resuspended radionuclides tend to stick to coarse particles (>1-3 µm), so we will have the sedimentation component due to the Stokes’ law.
a. Vi (eddy diffusion)
b. Vs (sedimentation – Stokes’ law)
As the GammaTRACER returned to its baseline level right after the radiation peak, we must assume that the plume did not cause any kind of deposition during the time it passed through the area of influence of the GammaTRACER. It is even more disconcerting that the deposition phase did not occur in the long term either, to this day.
This means that V↓ is effectively 0, which, according to its equations, would mean that there were no particles involved, the gravitational force was neglected, or the air increased its density to a value close to a solid state. As none of these precepts are valid in the real world, reductio ad absurdum, the radiation spikes do not have a physical origin, and therefore were plausibly fabricated.
5. TECHNICAL ANALYSIS OF THE ‘CYBER’ OPERATION
Radioactivity is invisible for the human eye. The capacity to approach an incident where radiation plays an important role, necessarily relies on a first responder’s predisposition to trust an instrument’s output.
Security is pretty much the same. We cannot just see security, we also have our instruments to see through its different layers.
In both cases, there is something in common: when approaching an abnormal situation, regardless of what your instruments say, you usually have a preliminary idea of what to expect.
When you create a scenario where radiation levels are fabricated, the goal is to generate a response based on your ability to control the notion about the specific physical environment your target has. That may be leveraged to support a narrative, to force a specific move from a target, etc. Therefore, I would like to clarify that I am not planning to speculate about any of them, not even the actors potentially involved. This is data-driven research, conceived to be impartially verified, regardless of subjective claims or specific interests.
The purpose of this research is to provide sufficient technical evidence that may be used as part of a rigorous assessment of the radiation spikes, detected in the CEZ, during the first forty-eight hours of the Russian invasion.
In accordance with this principle, the following analysis comprehensively describes the technical details that exhibit how, at least, one of the intended outcomes of this operation may plausibly be to inject manipulated radiation levels (H*(10)) into the infrastructure of the Automatic Radiation Monitoring System (ASKRS) of the Chernobyl Exclusion Zone. As a result, the regular processing logic of this system would have been altered to influence the publicly available, real-time representation of the radiation levels in the CEZ, which at that time was officially provided by ‘srp.ecocentre.kiev.ua’.
Anomalies
During the early stages of this research, when I was still collecting information to see if there was really something to look at, I remember that one of the things that tipped the scale was the following paragraph from the
Mike Wood et al. paper,
Figure 82 Mike Wood et Al. paper
At the time, most of the articles and comments I found were talking about power cuts to explain the lack of continuous measurements, before I figured out that the GammaTRACER were battery-powered devices, which obviously did not match that ‘selective’ pattern for going offline. As it will be elaborated later, it turned out that this behavior was the key to understanding the operation.
As I was researching this issue, additional abnormal patterns emerged. It is worth describing some of the most significant ones, as they provide the right context before putting the pieces together.
THE SIX STATIONS
In an interview for ‘
Le Figaro’ , CRIIRAD’s Bruno Chareyron queried why the IAEA, in the publication ‘
Update 1 - IAEA Director General Statement on Situation in Ukraine’, only mentioned the 9,46 μSvh-1 H*(10) value when there were other levels way higher. This was a well-directed question indeed, as during the 24th (of February) three monitoring stations within the Chernobyl NPP area reached levels over 50 μSvh-1: HZHTO 65,5 μSvh-1, HOYAT 54,2 μSvh-1 and DGS-2 58,8 μSvh-1.
Figure 83 Criirad quote
So, I spent some time digging into this, which led me to find the following official
document from Ukraine’s Ecocentre, the State Specialized Enterprise which carries out radiation monitoring in the CEZ.
Figure 84 Ecocentre statement translation
I also found the following screenshot , published by Ukraine’s Chernobyl Exclusion Zone State Agency (DAZV) during the 2020 forest fires crisis. It confirms they were using DataEXPERT to collect the information that is incorporated into their public reports. This reinforces the idea that the server where DataEXPERT was installed, which disappeared, played a significant role in this scenario.
Figure 85 DataEXPERT screenshot
In fact, I noticed that the version of DataEXPERT in the screenshot (v.04.0526) is still very close to the version I found (and reverse engineered) in an old DataEXPERT manual I managed to get while visiting a radiological laboratory at a Faculty of Medicine. This manual dates to 2006, just before the ASKRS system was deployed in the CEZ.
Figure 86 DataEXPERT manual
The version that can be seen in the screenshot found in the manual shows “v.04.0480”, so it is safe to assume the DataEXPERT version deployed in the CEZ, at least in 2020, was outdated. Nothing out of the normal if we consider the idiosyncrasy of the Industrial Control Systems world.
Figure 87 DataEXPERT version
The highest level reported in the Ecocentre’s document is 9,46 μSvh-1 (corresponding to the Pozharne DEPO radiation monitoring station), coincidentally the same value mentioned in the IAEA statement on the 25th (of February). On the other hand, the lowest level is 2,05 μSvh-1, detected at Vektor. So, we would have H*(10) values from 2,05 to 9,46 μSvh-1, which is the exact range of radiation levels explicitly mentioned in a statement published by the Czech Republic's State Office for Nuclear Safety (SÚJB).
Figure 88 Six stations reported to the IAEA
In that
statement, the Czech regulator also mentions the exact ‘Control Level Exceeding Factor’ values that the Ecocentre’s document contains. Finally, it confirms the SNRIU reported radiation levels for the CEZ through the
USIE system, instead of the IRMIS. It is reasonable to assume the SNRIU, in turn, would be receiving H*(10) levels from the SSE Ecocentre, likely the aforementioned official document.
But what is the
IRMIS system? It is one of the two ‘Emergency Preparedness and Response’ systems the IAEA maintains to share information about radiological incidents. The Member States voluntarily report the H*(10) information collected from their fixed radiation monitoring stations, aiming to pursue transparency and promote information sharing between stakeholders.
Figure 89 IRMIS description
It is interesting that the IRMIS
system stopped receiving data precisely on the 24th, because during the 24th, and part of the 25th, the H*(10) values collected from all the radiation monitoring stations in the CEZ was still being transmitted to the real-time radiation map available on the Ecocentre website. So, it is reasonable to assume that no communication problems could be adduced, as opposed to the
ZNPP case. Without entering into other considerations, I assume problems directly derived from the Russian occupation of the facilities.
Finally, it can be inferred that the IAEA simply based their statement on the data the SNRUI reported to them, without having any further visibility into the actual radiation levels. In fact, the IAEA confirmed this scenario in its ‘Summary Report by the Director General’
publication.
Figure 90 IAEA statement on IRMIS
However, the SNRIU only reported to the IAEA the H*(10) values of six specific stations. A practice for which I am yet to find a logical explanation, bearing in mind those values did not come from manually taken measurements, but directly from the ASKRS system as I will demonstrate next.
I could confirm the H*(10) values from five of the six regulatory stations that were reported by the SNRIU, thanks to the historic dataset from saveecobot.com
However, when I was double checking the reported levels, I found out that the spike for the Yanov Station (3,46 μSvh-1) was never recorded by any of the publicly available sources for radioactivity levels in the CEZ at that moment: srp.ecocentre.kiev.ua and saveecobot.com. Please note that these websites were also used by
France’s IRSN.
Figure 91 IRSN statement on Ukraine
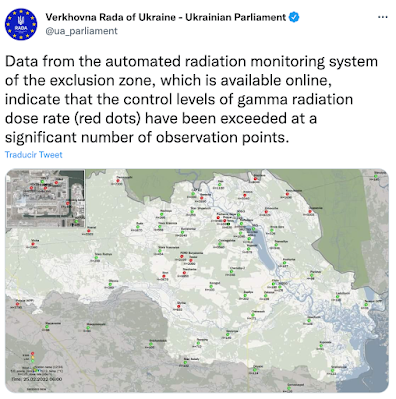
By using the image from the Ukrainian Parliament’s
tweet , we can see that at 6:00 AM on the 25th all radiation levels match with those reported in the Ecocentre’s document, except for Yanov Station which keeps its regular baseline level (~620 nSvh-1) instead of 3,46 μSvh-1
Figure 92 Missing spike for Yanov Station
The only problematic value is the H*(10) (‘Fixed value’ in the table), as the ‘Average reading in 2021’ and ‘Control level’ for the Yanov Station match with the following table of
historic measurements.
Figure 93 H*(10) values in 2020
This monitoring station can be easily found on Google Maps , which allows us to verify that it is a GammaTRACER+SkyLINK deployment.
Figure 94 Yanov Station – GammaTRACER
Besides this anomaly, one of the main questions is why SNRIU did not report the following values of three regulatory stations which were way higher, also collected from the same ASKRS system.
Obviously, I do not know the answer, neither do I want to speculate on the reasons. However, it is worth noting that these unreported radiation spikes are coincidentally in the range of the Operational Intervention Levels (OIL) for reactor emergencies and spent fuel (OIL2γ , 25 µSv/h – 100µSv/h).
According to the IAEA:
An OIL is a type of action level that is used immediately and directly (without further assessment) to determine the appropriate protective actions on the basis of an environmental measurement . (IAEA, 2007)
Thus, if these stations had been officially reported, the IAEA should have initiated specific emergency response procedures. Instead, the IAEA merely assessed the reported levels as follows:
"Some of these measurements from the Chornobyl Exclusion Zone indicated an increase in the gamma dose rates that was attributed to the displacement of soil due to heavy machinery movements in the area. Based on these data, the IAEA assessed radiation levels as low and within the operational range measured in the exclusion zone since it was established, and therefore considered that they posed no hazard to the public. (IAEA, 2022)"


